 There is no scientific evidience that astrology works, and there probably never will be. The only largescale study that appeared to show statistical significance, by Michel Gauquelin, may have been methodologically flawed, and there was a possible problem with multiple comparisons. Even if Gauquelin’s results aren’t flawed, they suggest a barebones astrological system, with no signs or aspects, where the only planets that one can use are the Moon, Venus, Mars, Jupiter and Saturn.
However just because there is no scientific evidence that astrology works doesn’t mean that astrology doesn’t work. The aim of astrology is to paint a picture of a moment in time in such vivid detail that its fundamental meaning is obvious. So obvious that it cannot be contradicted by other moments of time, where astrology fails to provided a good description. I know that what I have just written is nonsense, from a scientific perspective, but if we practice astrology we have to go beyond the scientific method.
Let’s look at an event. The discovery of Uranus on the evening of March 13 1781. We don’t know the precise time, but it was between 10 and 11 pm, in Bath, England. Here’s the chart, for 10.30 pm:
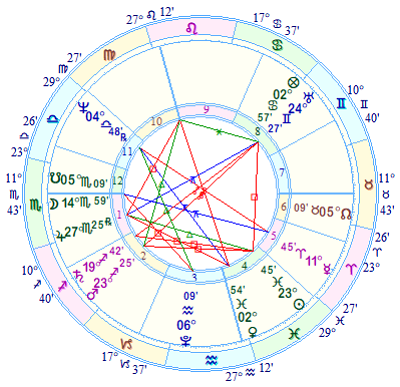
We would expect Uranus to be prominent in the horoscope, and it is. It is above the horizon, opposition the Mars-Saturn conjunction, and square the Sun. These aspects give us an idea about what Uranus means. The Mars-Saturn conjunction relates to accidents and death, and in Sagittarius it is a death that might be fiery and explosive. The Sun-Mars square gives an image of wilfulness, and tied to Saturn it might be the violent attempt to escape restriction. Overall, we get an idea that Uranus is a violent and perhaps malefic planet, and its link with earthquakes, explosions and revolutions makes sense.
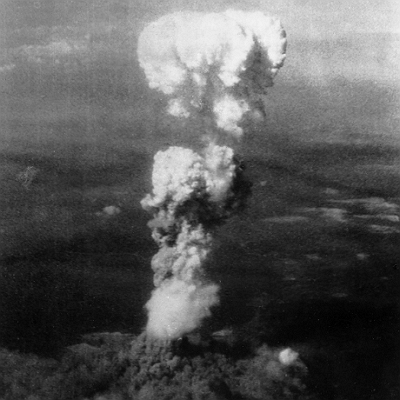
Going back to moments in time, what is the most important event in the Twentieth Century? That’s a controversial question, and some people might see the question purely in terms of technology and convenience. For example, the invention of the internet or the launch of the first smart phone. However in terms of lives and civilization, I am thinking more of the assassination of Archduke Ferdinand, in Sarajevo in 1914, or the detonation of an atomic bomb over Hirsoshima. After these events, the world was never the same. One event launched the First World War, the other actualized the threat of global nuclear destruction.
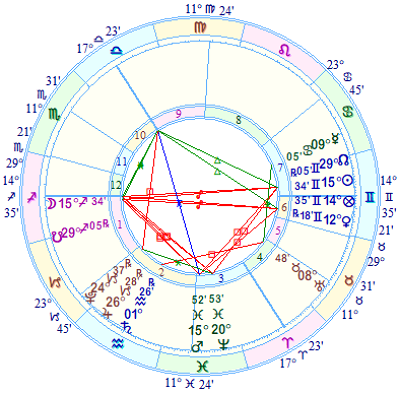
This is the chart for the assassination of Archduke Ferdinand, set for 11 am on June 28 1914, in Sarajevo. The time is close, but probably not exact:
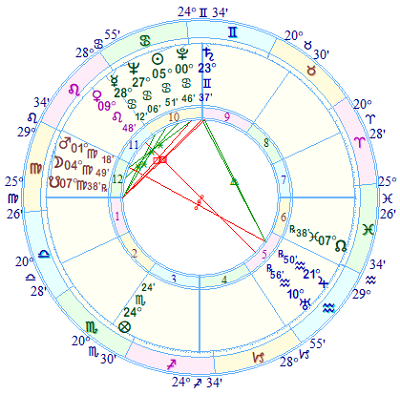
It is the kind of chart that anyone who has entered the astrology mindset will understand, particularly if they use midpoints. There is a Moon-Mars conjunction in the Twelfth House, which points to a hidden attack, or an ambush. Saturn is on the Midheaven, indicating the seriousness of the event, and a Venus-Uranus opposition is on the Ascendant-Midheaven midpoint.
The Ascendant-Midheaven midpoint, along with the Sun-Moon midpoint, are the two midpoints every astrologer should include in their chart analyses. The Ascendant-Midheaven represents the time and the place, and with Uranus on this point, we get a picture of what’s going on at 11 am on June 28 1914 in Sarajevo. In the assassination chart, Uranus on the midpoint is given added strength by Venus. The fact that Venus is the planet of love is irrelevant – it should instead be seen as a trigger. And if the the assassination happened exactly at 11 am, Venus would be exactly semi-square the Midheaven.
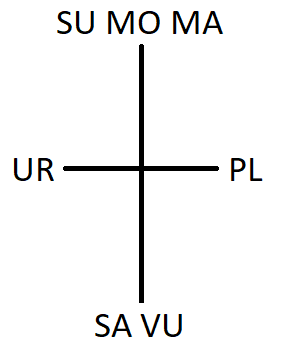
Another midpoint to consider is Mars-Uranus. This represents violent actions. At the time of the assassination the Sun and Jupiter were in sesquiquadrate aspect (135 degrees) and both planets were on the Mars-Uranus midpoint. In other words, we have the configuraton SU = MA/UR = JU. This describes a successful assassination. Jupiter is about successful action – even though the action was murderous. Witte and Lefeldt described the Sun on the Mars-Uranus midpoint as “Sudden bodily action. The energetic or fierce man. Sudden injury to the body”. Sounds about right.
Yet there is a problem. I am an astrologer, and the assassination horoscope makes perfect sense to me. However, a sceptic would argue that I am seeing what I want to see. And I would accept that if you’re not up to your neck in astrological symbolism, the last few paragraphs I have written are pretty crazy.
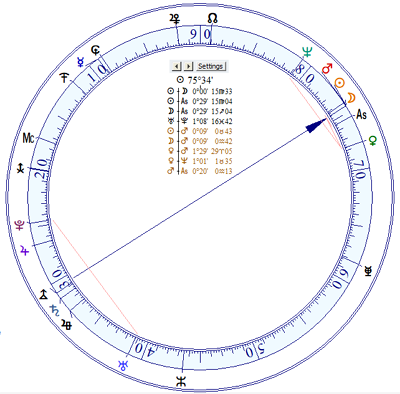
So let us look at another chart. A chart that is simple, beautiful and horrible:
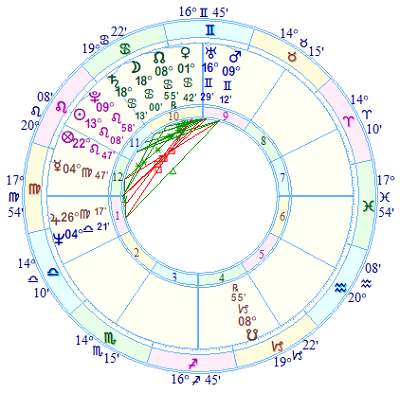
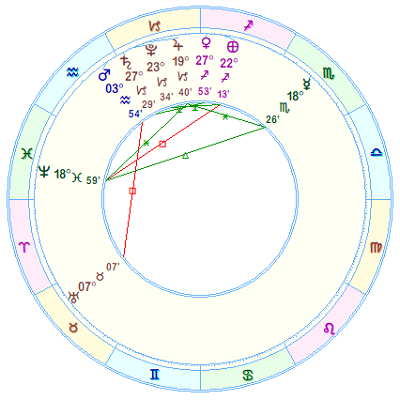
This is the horoscope for the precise second the Hiroshima bomb exploded, at 8:16.02 am on August 6 1945, Hiroshima Time. The bomb left the plane less than a minute earlier, when the plane was flying at 31,060 feet. By the time of the explosion, it was 1,968 feet over the city.
It could be argued, from a technological point of view, that the Hiroshima bomb was not a major event, because the world’s first atomic explosion had already taken place, in New Mexico, the previous month. However, it was the first atomic bomb to be dropped from an aeroplane, with the intention of killing people. It was also the first uranium bomb – the New Mexico and Nagasaki bombs were made with plutonium.
The planet that rules uranium is of course Uranus. When we look at the horoscope of the bombing, we can see that Uranus is exacty on the Midheaven. The Midheaven is at 16 degrees 45 minutes Gemini, and Uranus is at 16 degrees 29 Gemini. The Midheaven is the highest point on the ecliptic, and the horoscope clearly describes an atomic bomb, with a uranium core, exploding high in the sky.
We can mention other things about the chart. The fact that Uranus is conjunct Mars, is aspecting the Sun-Moon and Ascendant-Midheaven midpoint, and amazingly is only two minutes off the midpoint of these two midpoints. Additionally, the Moon is making an exact conjuncton to Saturn, and the Sun is aspecting the Mars-Saturn midpoint. However these are subtleties. Uranus’s position right at the top of the chart, at the moment a uranium bomb explodes for the first time, leads to two alternative conclusions. Either those planning the bombing used astrology to fine-tune the timing of the event, or in some situations astrology works.
Technical note: A planet is considered to be on a midpoint when it is conjunct, opposition, square, semisquare or sesquiquadrate the point. Orbs are no more than 1 minute and 30 seconds, though I generally use orbs of less than a minute.
 On Saturday June 20 2020, at 10.44 pm London time, the Sun reaches its maximum angular distance from the celestial equator. This is the moment of the Summer Solstice, when the Sun moves into Cancer. We can regard it as the opening of a gateway, where the cosmic energy manifests in the material realm. If you are into Celtic mythology, you’ll perhaps know that the Summer Solstice is the time when the king is sacrificed, and his deputy, the tanist, takes over the job. He gets sacrificed six months later, at the Winter Solstice.
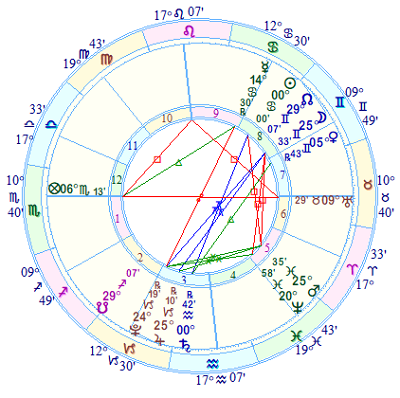
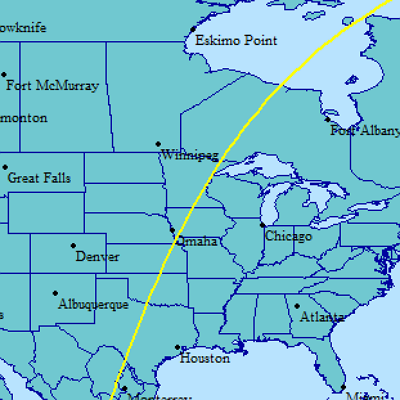
 Just a quick note about heliocentric astrology. This is astrology that is based on a heliocentric rather than a geocentric perspective. Heliocentric astrology is often used in financial astrology, and if one is tracking the unfolding of current events one should keep a close eye on heliocentric trends.
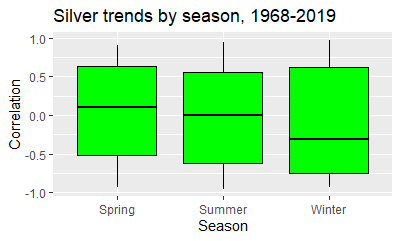
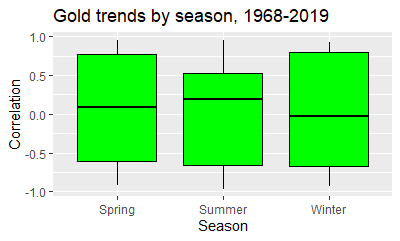
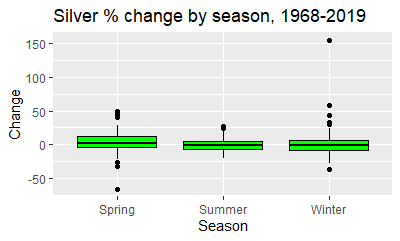
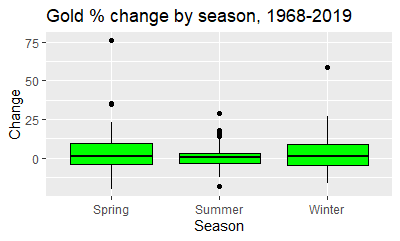
 It doesn’t matter how you make predictions. You can use astrology, economics, meteorology, whatever. Some people even use seasonanality to predict things. For example, there is a view that precious metals go down during the summer months – indeed, they call it “the summer doldrums”. So I thought I would put this theory to the test.